In Montpellier for Information Visualization 2012.
Here we will present the updates for our research projects dedicated to the real-time observation of cities: ConnectiCity and VersuS.
With these two projects we have tried understand the current transformation of urban contexts and in the ways in which citizens learn, work, relate, consume and are aware about their environment.
We have started our analysis by observing how the affordances of space are generated at different levels, such as social, cultural, political, administrative and relational, defining in our perception what is possible, impossible, suggested, advised against, prohibited.
Mobile devices transform our perception of space, time and relations.
Landmark consumer products such as the Sony Walkman have opened up the way for the possibility to personalize our experience of public space. While we walked through cities, devices like the Walkman allowed us to reinterpret space and reconfigure it, transforming it into places of our emotion, fantasy or memory.
Mobile devices, such as cell phones and smartphones, radicalize this process.
While running in a park a mobile phone call will be able to completely transform our perception of space, which could become – even for a limited amount of time – an ubiquitous office, a global living room or a place for distributed entertainment, emotion, relation.
Citizens have started using digital technologies and networks to express their ideas, visions, wishes, emotions and expectations.
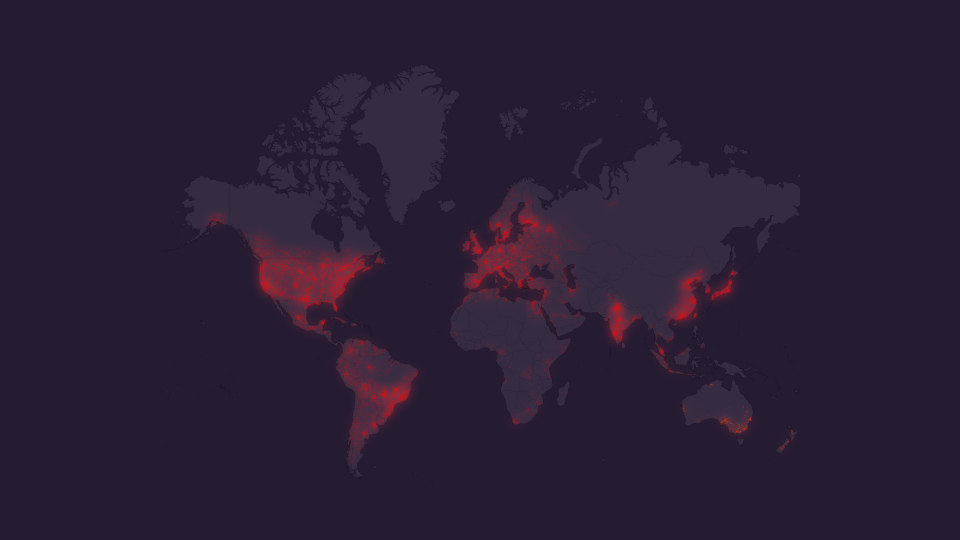
This image above represents (in red) the locations of many (over 7 million) internet users who, in 2011, have used social networks (Facebook, Twitter, Foursquare, Instagram, Google+) to say “I have an idea!” (e.g.: messages in one of 29 languages expressing the sentence “I have an idea” or one of dozens of variations) and at least 3 other users replied to them (in meaningful ways, including comments, ways to make the idea better or offers for collaboration, as understood by an automatic natural language analysis of the follow-up posts).
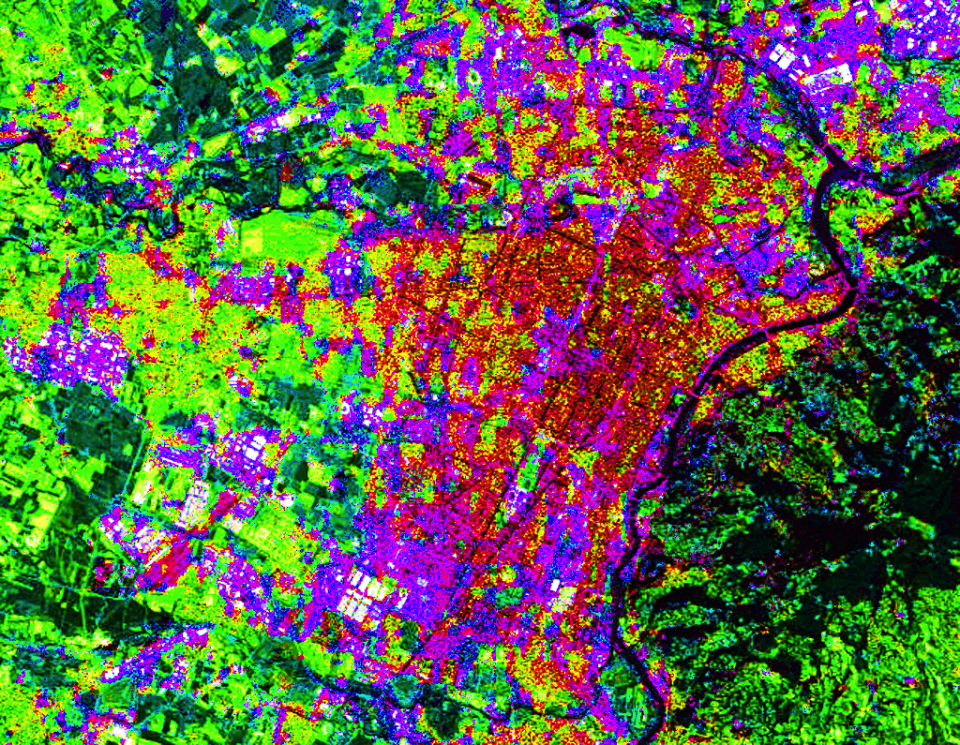
In this image above we can see the city of Turin completely drawn through social media and user generated content (starting from a black canvas, every time a geolocated user generated content is sensed on Facebook, Twitter, Instagram and Foursquare, a corresponding pixel is augmented in saturation; this process has been done throughout August, September, October and November 2011 to obtain the result visible in the image).
From these and other examples it is possible to see how citizens are constantly using social media to express themselves in city spaces, describing their points of view on fundamental topics such as mobility, ecology, job market, emotions, consumption, entertainment, culture.
Through the ConnectiCity and VersuS projects we tried to design and develop systems which are able to capture this emergent user-generated information and transform it into usable knowledge for citizens, administrations, activists and companies.
Many results have been produced including:
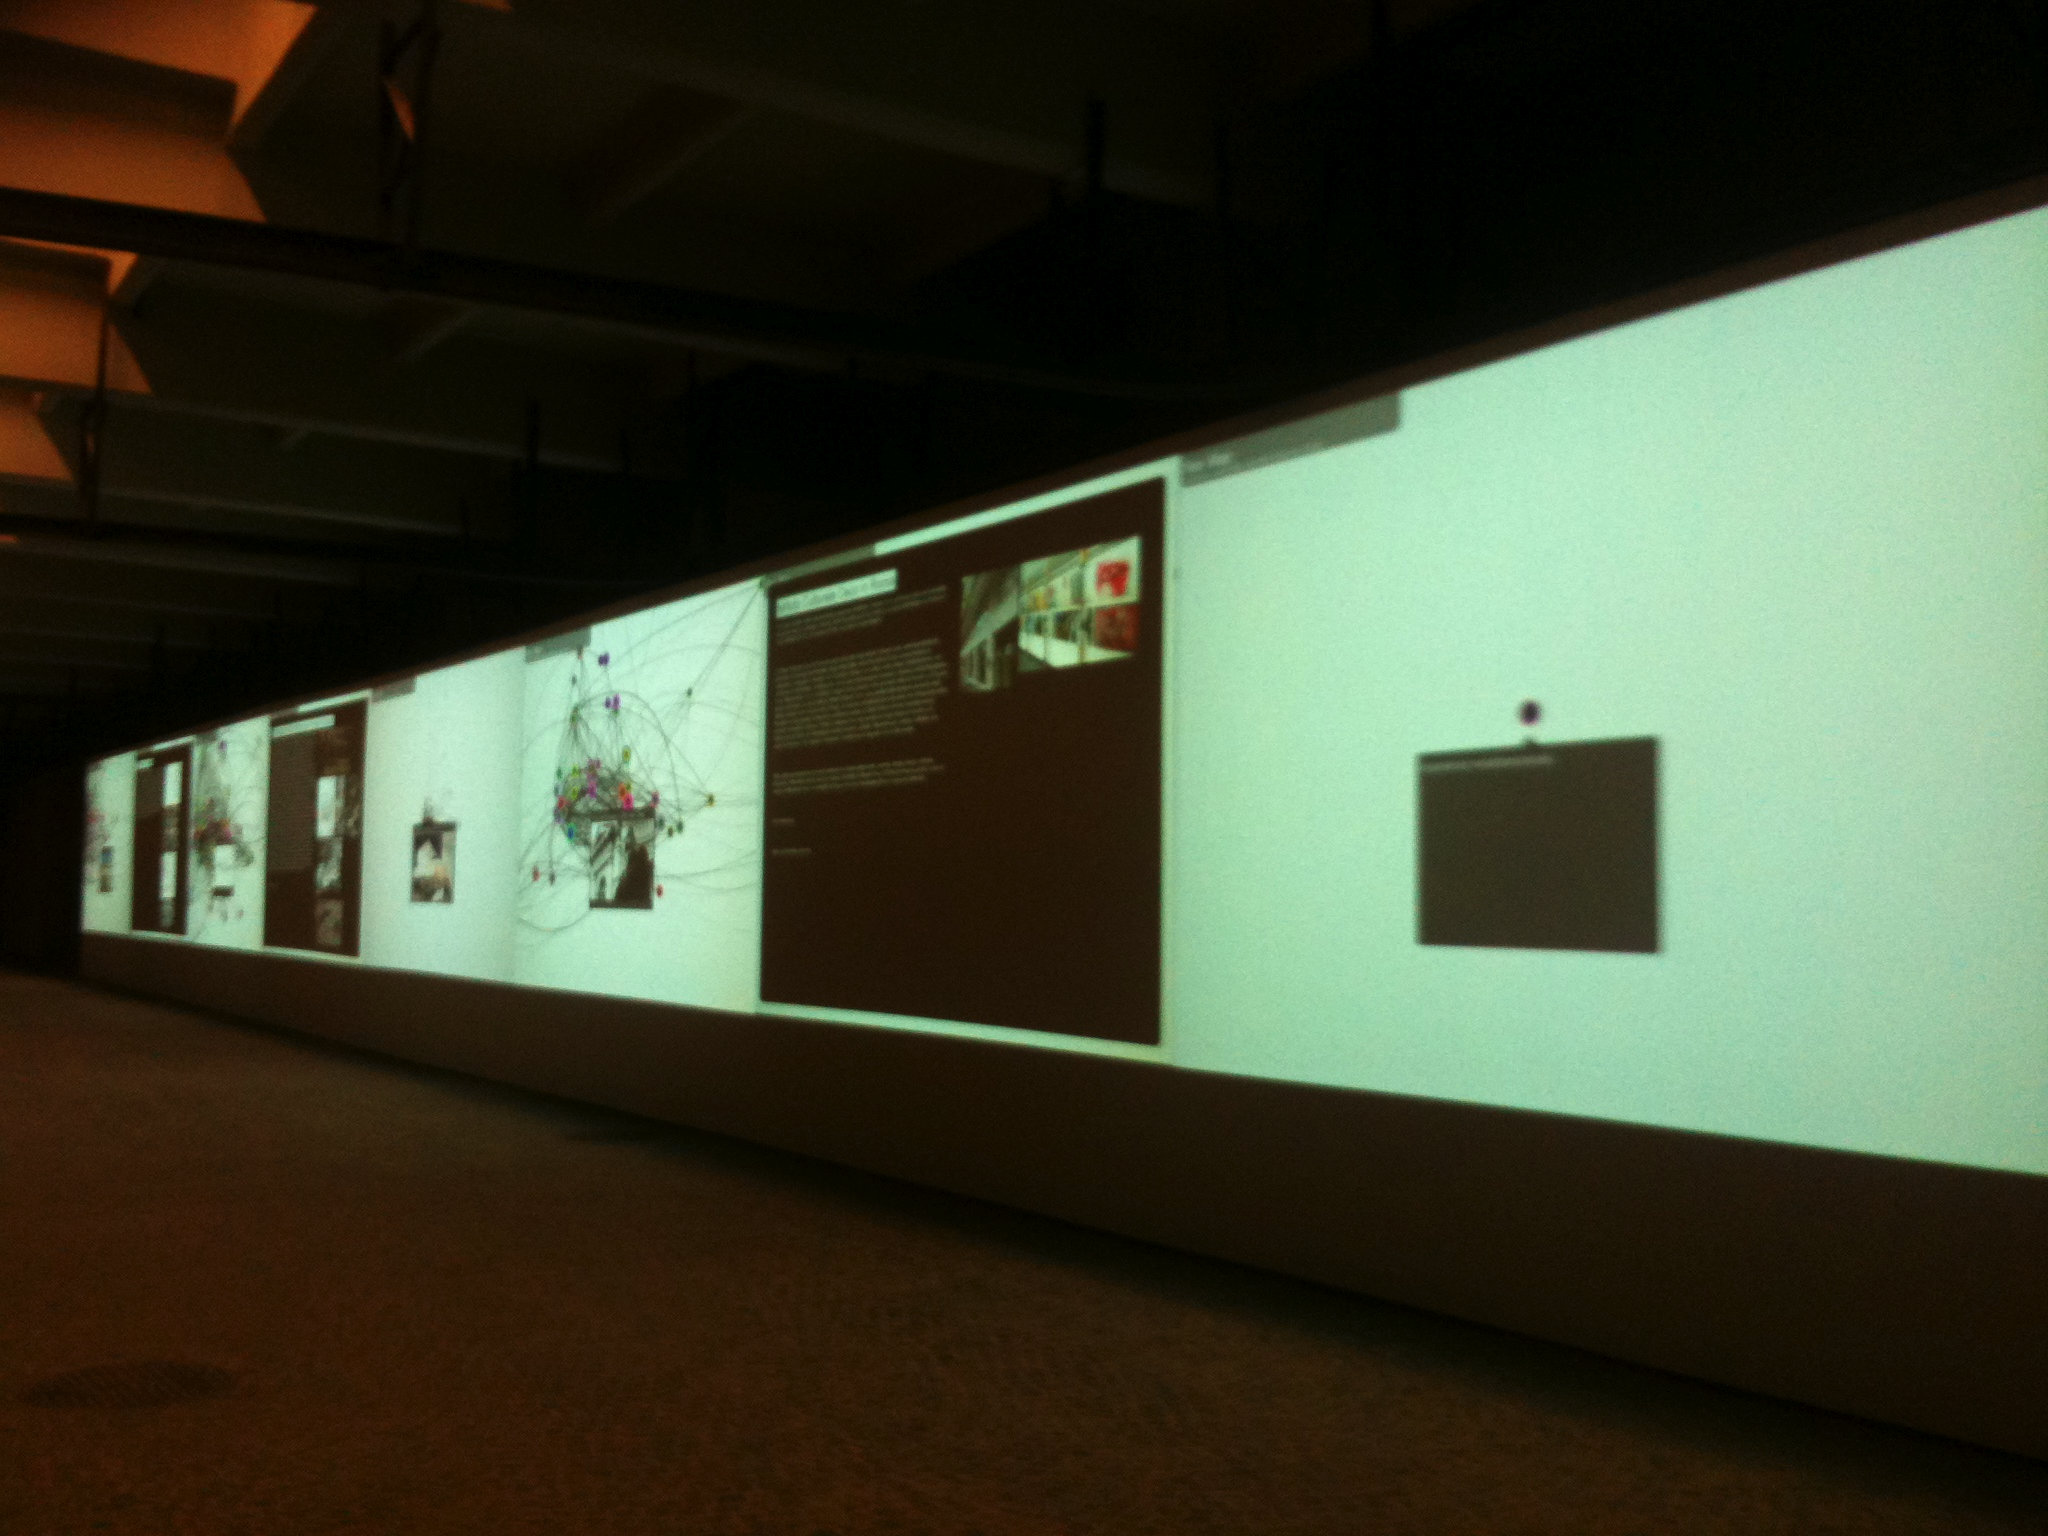
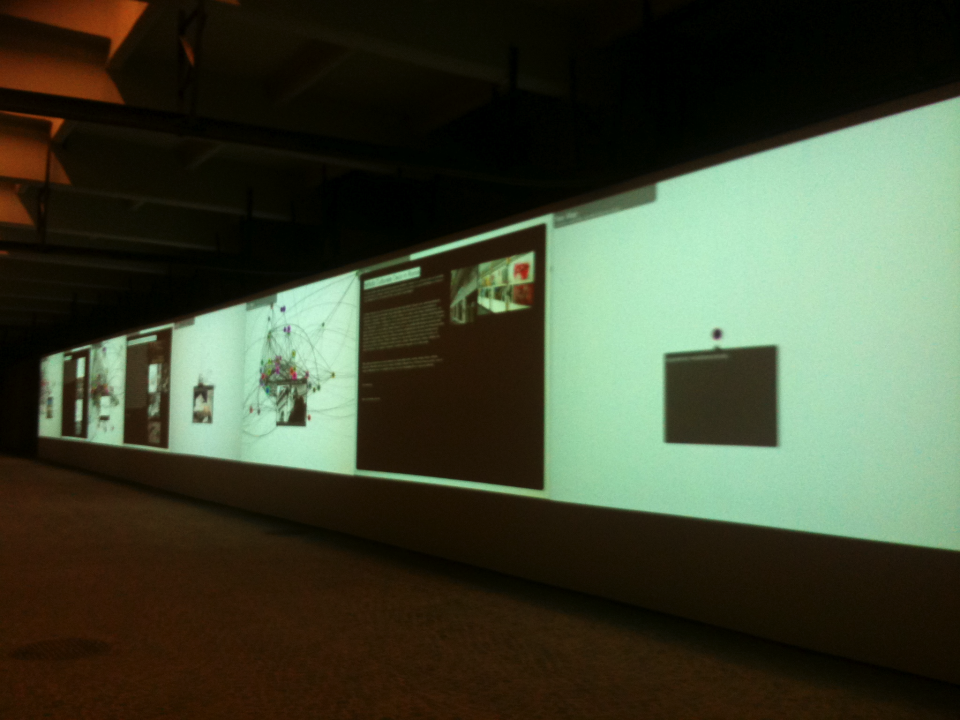
- the Atlas of Rome, a 35 meter urban screen capturing in real time the ideas, desires, visions and expectations of citizens of the city of Rome
- VersuS, a realtime system which can visualize and explain the ways in which citizens use social media to express themselves about fundamental issues for the city
- VersuS planet edition, dedicated to the possibility to observe and compare multiple cities
- Maps of Babel, in which cities can be observed to gain better understandings about the ways in which different cultures and nationalities express and relate in cities
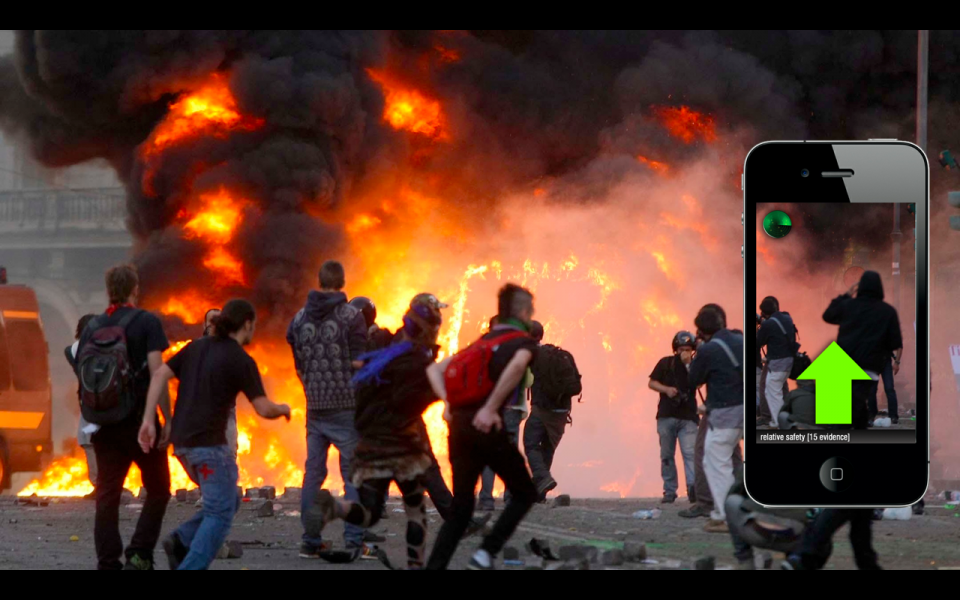
- AR for riots and Hatemeter
The first one is a system which is designed for violent or emergency scenarios in cities (such as riots, earthquakes, natural disasters…). A realtime system collects information generated through social networks and parses them using Natural Language Analysis to understand the locations (through GPS and Geographical Named Entities) of violent, dangerous, emergent events, or of safe locations, places of first assistance and, in general, safe spots or way outs of difficult situations.
This information is made accessible to users through a special interface, designed for use in emergency situations, where an immediate, thought free information visualization can make the difference in allowing people to react quickly and effectively: an Augmented Reality display shows a color coded arrow; scan from left to right to understand the safest way out or the nearest safe spot, as inferred from the information provided by users (and, eventually, by institutions and organizations) on social networks, in real time. Red means danger, green means safe.
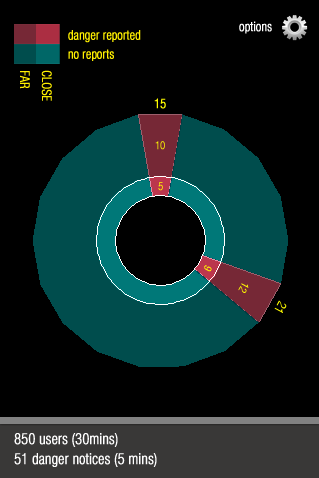
The second one, the HateMeter, uses the same technologies to identify the direction in which a certain emotion (“Hate” in the presented prototype) is strongest, as inferred in realtime by harvesting user generated content on Facebook, Twitter, Instagram, Foursquare.
Both applications provide scenarios according to which the forms of emergent expression enacted by users across cultures and languages can be used to produce useful, usable information, available in accessible ways, designed to transform our perception of public space and redefining the concepts of citizenship, transforming it into a more active, informed agency.
This series of projects will be our main focus for the next few months. We welcome suggestions, collaborations and ideas for novel forms usage scenarios.
[slideshare id=13651239&doc=presentation-120716014326-phpapp02]
![[ AOS ] Art is Open Source](https://www.artisopensource.net/network/artisopensource/wp-content/uploads/2020/03/AOSLogo-01.png)
