Just back from the Visualizing Europe event organized by Seed Media group in Bruxelles.
The event was an incredibly interesting gathering of people interested in the possibilites represented by Information Visualization. It was a very insightful event and we are just starting to make sense of all the information and input that we received at the conference and, afterward, by talking with lots of the people who were contributing to it either by presenting their points of view or by being there as one of the most interested audiences which I seem to remember in the last few years.
First of all, a consideration: it seems that there is a strong community forming around the themes of information visualization. Many people seemed to know each other, or, at least, to have read each others’ blog, papers and researchers.
We were a bit of outsiders, in this sense, as we are not directly connected to the Information Visualization theme, as we (AOS and FakePress) chose to follow a more general path in which InfoViz is one of the most strategic tools that we use to implement our strategies, but we operate on a broader scale in which the objective is to confront the issues which constitute the body of our artistic expression, scientific researches, professional productions and political agendas.
So what we were looking for in the Information Visualization arena is a strategic support for our objectives.
And this is really interesting, because lots of people there were looking for the same thing: the European Union, General Electric, all the big players were looking to see if the theories and techniques of Information Visualization could become a tool to confront with radically complex problems and issues, creating tools for evaluation, monitoring, planning, understanding, awareness, communication and action.
I don’t know if they did (and i would definitely hope so), but I can explain my approach.
But, first of all, here are the slides which I presented at the conference:
Our presentation started to define our goals directly from the beginning: the title “Sensible Data“.
Because data has become a very strange beast in these last few years. We are now able to handling hundreds of millions of rows of data with relative ease, and we are beginning to be able to integrate data from hundreds of different sources, including social networks, open data providers, science, organizations and more.
Using technologies that are easily available, and theories and methodologies that are accessibly documented, and software tools and languages that enable us to work in a state of relative ease, we are able to work on all these data and information to create the most beautiful representations for them. This process is fundamental, as it is connected, most of the times, to the only way that people, researchers, managers, institutions and companies have that is sufficiently powerful and expressive in assisting us in understanding data, and to make us remember what we understood, among the powerful information flood which we live everyday. Furthermore, the interactive characteristics of many of these visualizations transform beauty into utility, turning them into actual usable tools in which we are able to navigate and explore data and, in the best cases, to transform it, bend it and restructure it for our own, personal needs.
During Visualizing Europe many presentation succeeded in showing how powerful these techniques can be. The development tools by Bestiario, the really expressive visualizations by David McCandless, the insightful ones by Moritz Stefaner, the explorations into open knowledge and data by Gregor Aisch, the creative scenarios of the Senseable Cities Lab presented by Assaf Biderman, and the views on the drastic possibilities offered by collaborative processes such as Open Street Map presented by Peter Miller, as well as the insightful scenarios described by Enrico Bertini and the wonderful contributions by the panels coordinators Andrew Vande Moere, and Jonathan Grey of the Open Knowledge Foundation.
We have really found one thing missing, though, which was only provided by the presentation of the Senseable Cities Lab of the MIT when dealing with the concept of the City Operating System, in Enrico Bertini‘s presentation and in the Open Knowledge Foundation‘s presence: the broader picture.
There definitely is a usable and useful scenario here. Which is made of collaborations, multidisciplinary intersections and collaborative strategies. All this describes an incredibly fertile environment in which sciences, humanities, design, architecture, engineering and art can collaborate to a degree that has never been experienced before in human history. And that is a complete game-changer, being able to reinvent politics, business, society.
The works of the young designers that have been presented during the conference are just plain wonderful and really insightful. But I guess that more energy should be dedicated to highlighting the breakthrough scenarios that can be created, bringing out the more strategic discussions from closed rooms and turning them into public discussions. And Visualizing Europe has been an impressive opportunity for this, too.
While lots of dedication was poured into showing “the works”, some really interesting energied have been dedicated to opening up a scenario for more strategic discussions. For exemple by creating an active role in the conference for the representatives of the European Commission and OECD, Franco Accordino, Jean-Claude Burgelman and Toby Green.
In our contribution to the discussion, both using the presentation which we prepared and by embracing active discussions with the people who attended the event, we tried to assess the more strategic part of the issues we were confronting.
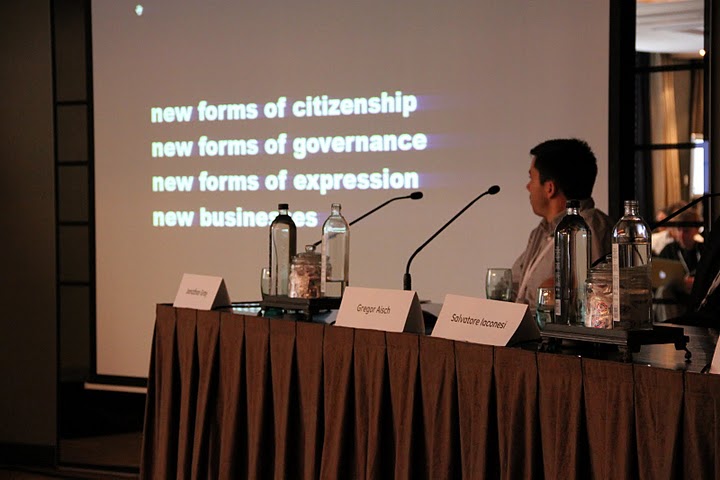
We declared our objectives quite clearly, describing the possibility to create
- new forms of citizenship
- new forms of governance
- new forms of expression
- new businesses
And we thoroughly (or, at least, as much as we could in the limited timespan) explained our points of view in these perspectives. Which revolves around the possibility to invent entirely new imaginaries for our daily lives New ways for shopping, working, discussing, having fun, being aware about the environment, of our urban environment, of our business.
This is why we create such radical initiatives at Art is Open Source and FakePress. Projects like Squatting Supermarkets, ConnectiCity, Nuclear Anxiety and Leaf++ are a lot more than activism, politics, science and art. They are about observing the changing world. Faster than science, law, business and ethics. It is about creating and enacting scenarios, now. So that we know that they are possible. And successful. To show paths and to open dialogues. And to provide tools (all the software products used by FakePress and AOS in their projects are available as Open Source platforms).
So, if I had to think of a way to make events like Visualizing Europe a bit better than they already are, I would say: on with the strategy! It would have been wonderful, for example, if less time was dedicated to the presentation part, and something like a collaborative workshop was introduced, in which people could actively participate on a theme, action or project of some sort: designers, strategists, managers, artists, anthropologists, engineers.
Because business, arts, design, architecture, education, politics, economy and society are changing, and one of the largest mutations of all these things is that it make little to no sense on imagining to being able to do significative things alone.
At the end: thanks to Visualizing Europe to letting such a wonderful event happen, and to enabling so many processes and relationships to start up!
![[ AOS ] Art is Open Source](https://www.artisopensource.net/network/artisopensource/wp-content/uploads/2020/03/AOSLogo-01.png)

