On May 17th 2012, we took part to prof. Marco Stancati’s course of Media Planning at La Sapienza University of Rome with a lecture on the scenarios offered by Augmented Reality to the creation of novel opportunities for communication and business.
HERE you can find some information about our lecture and the MediaPlanning course.
HERE you can download the slides we used for the lecture
(The slides are a lighter version of the ones we used in class, which were full of videos and hi-res images: please feel free to contact us should you want the original ones)
In the lecture, we started from a series of definitions about what, in our times, can be considered as “Augmented Reality”
In our definitions we chose to describe a wider form of the term, not limiting it to the set of applications to which we’ve all been accustomed to , and abandoning for a moment the vision of people happily strolling through cities with their smartphones raised in front of their faces.
Nonetheless we used classical examples of AR to introduce a possible evolution of what is/will be possible in our cities using ubiquitous technologies.
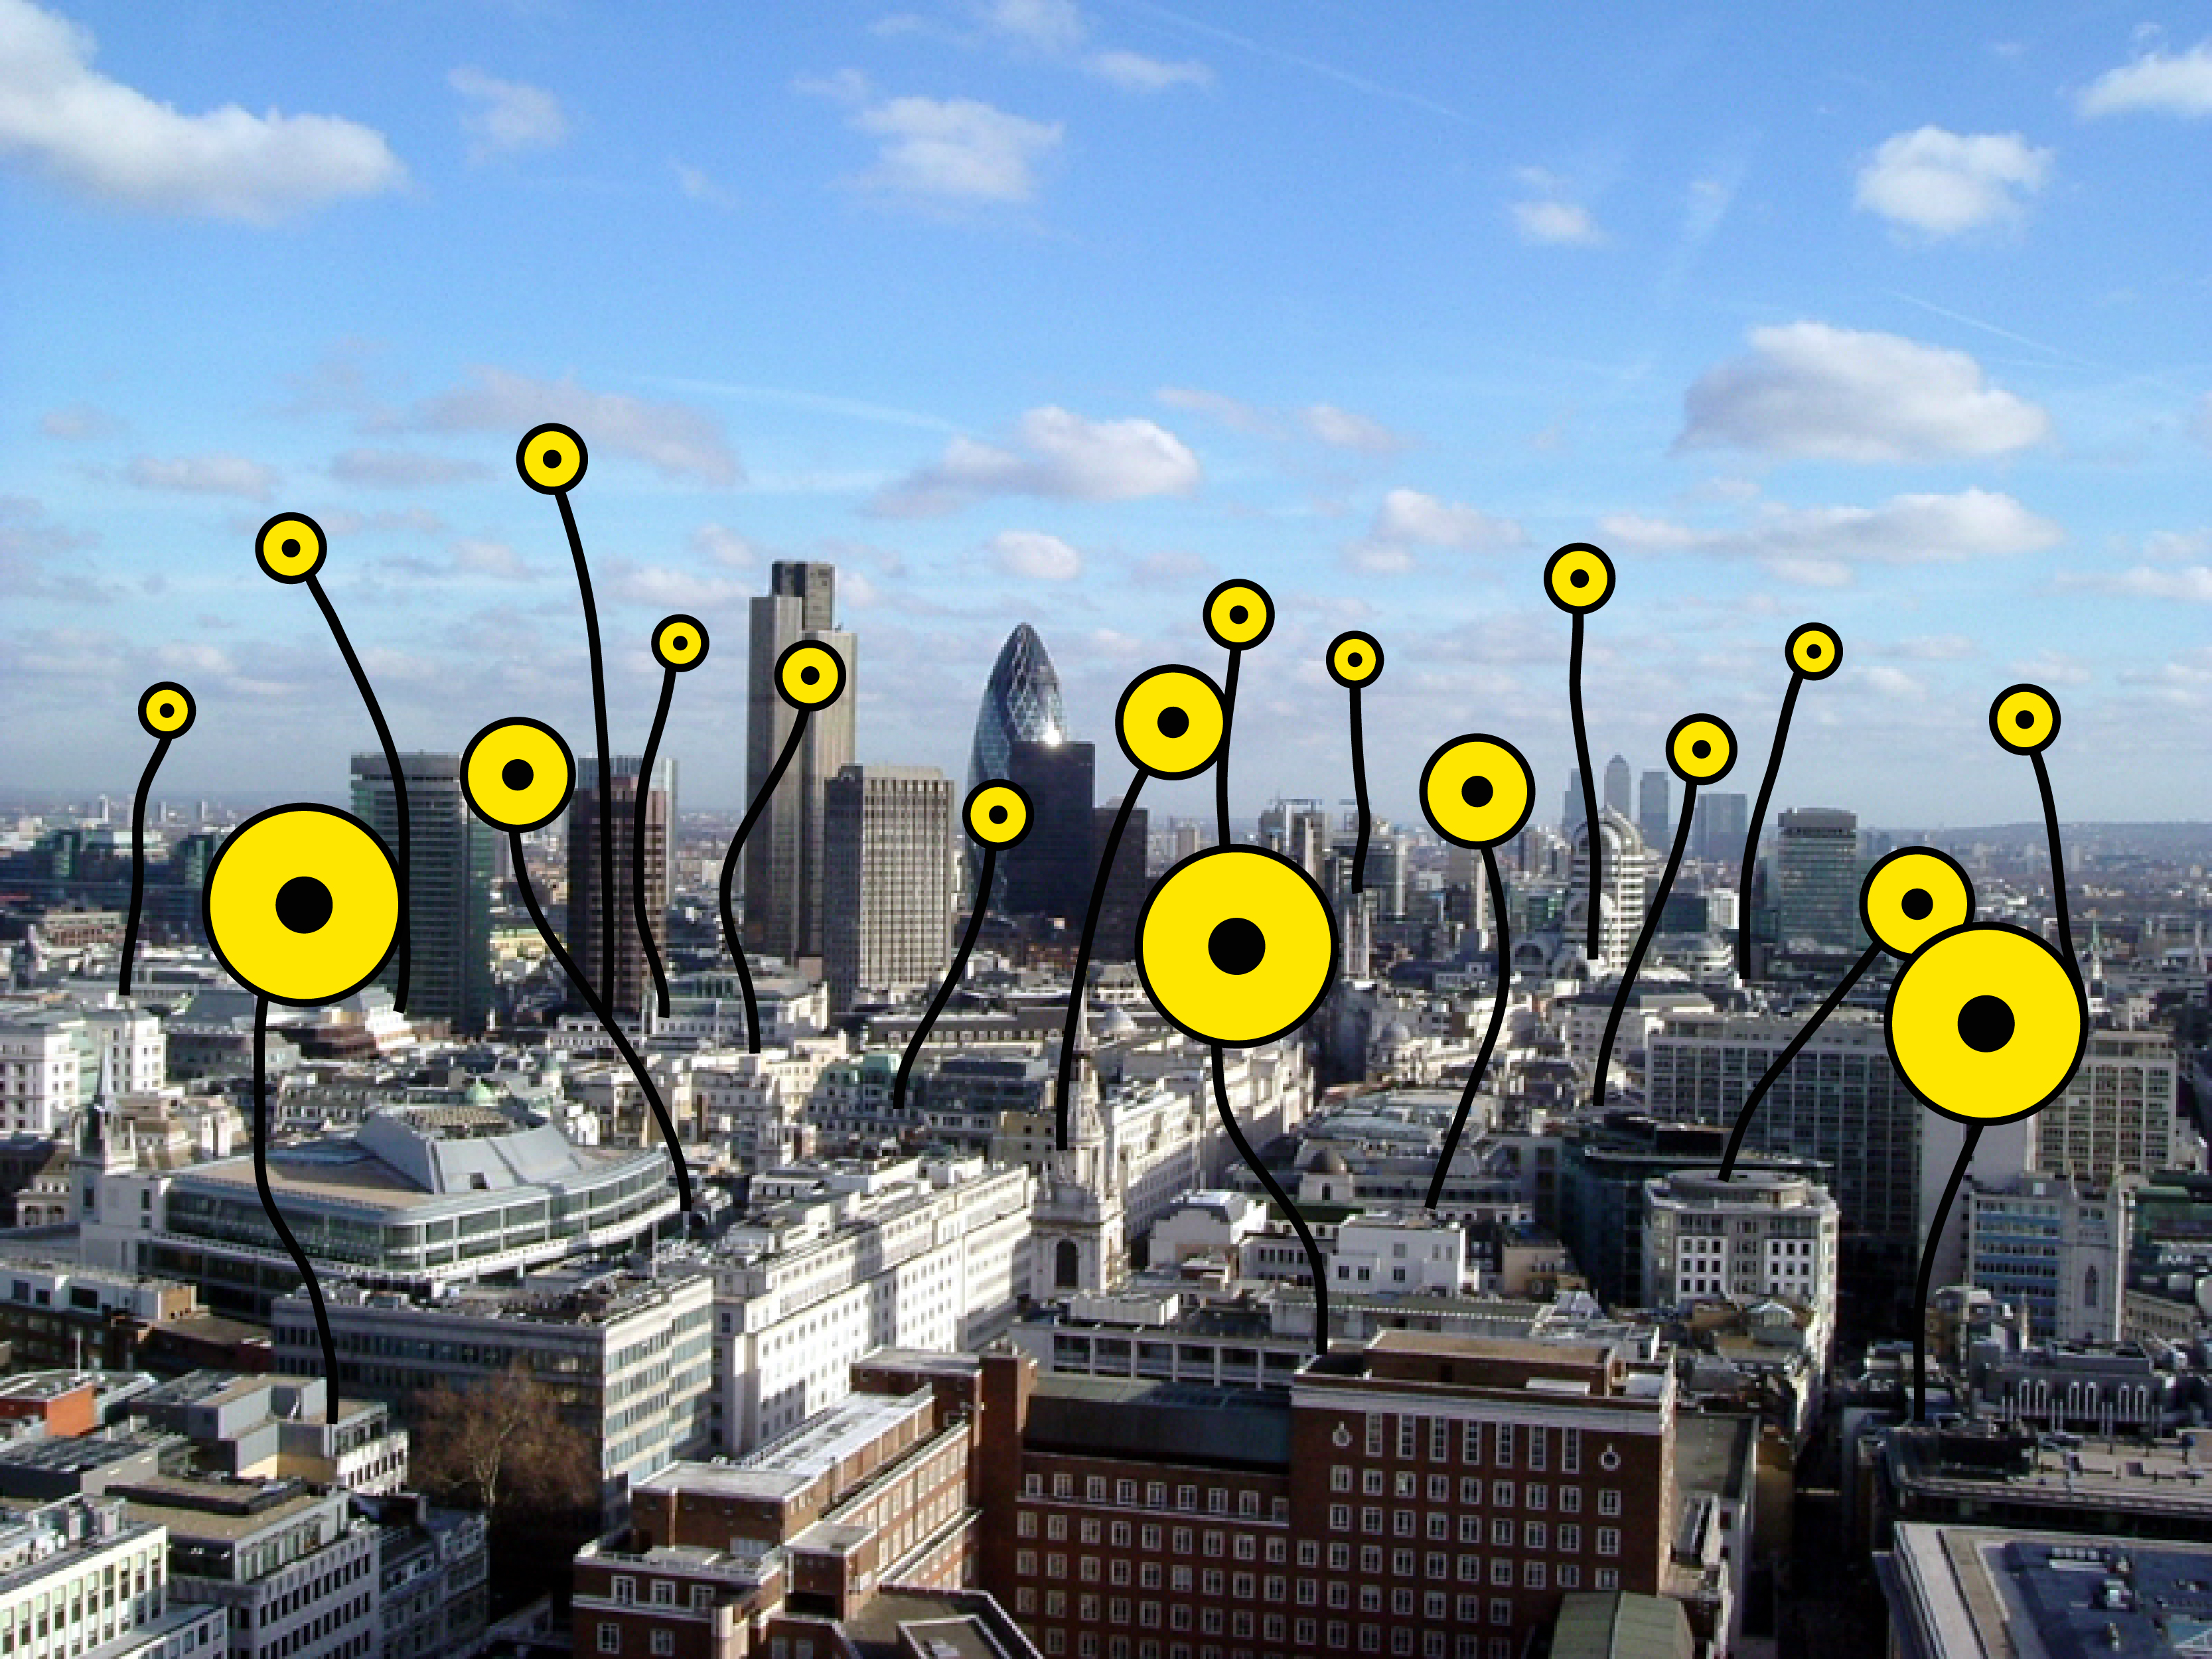
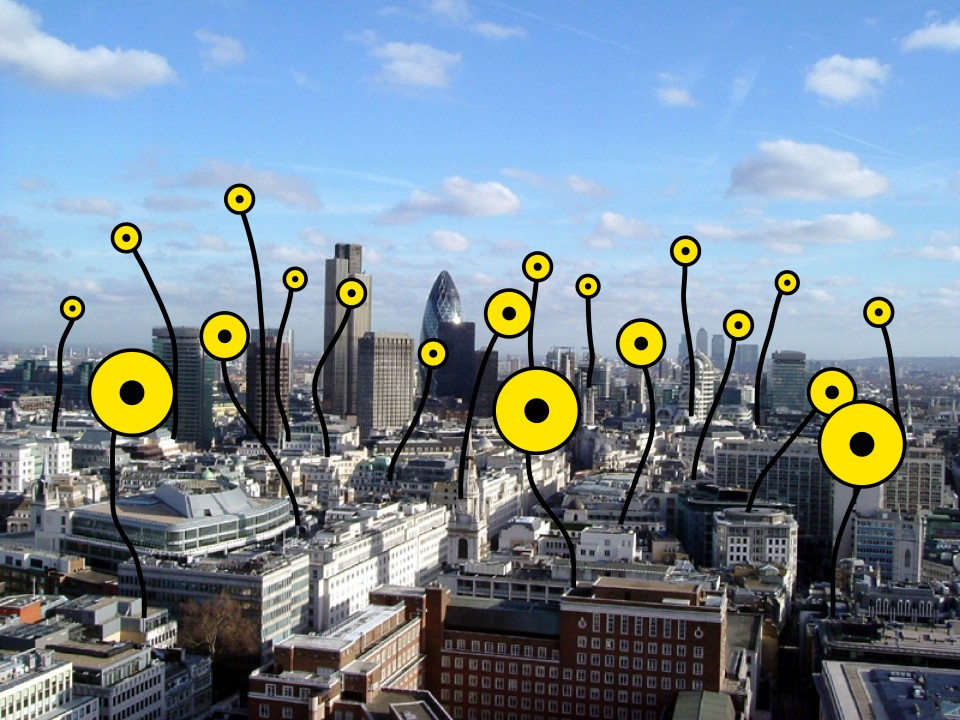
We focused on the idea of the Augmented City.
In this vision of the city, many subjects (individuals, organizations and, using sensors, also the city itself) add layers of digital information, in real-time. We can access and experience these sets of information in multiple ways, and we can also use them to compose, dynamically, our personal vision of the city, by remixing, re-arranging, re-combining and mashing-up all the information layers which are available.
This is a very interesting situation for cities and their citizens, as it enables for the creation of entire new scenarios for communication, business and personal expression.
It also opens up possibilities which will probably have a high impact on the ways in which, for example, enterprises design their own products, and the ways in which they create the strategies according to which products and services are communicated, marketed, monitored.
We discussed this scenario below, among the many possible:
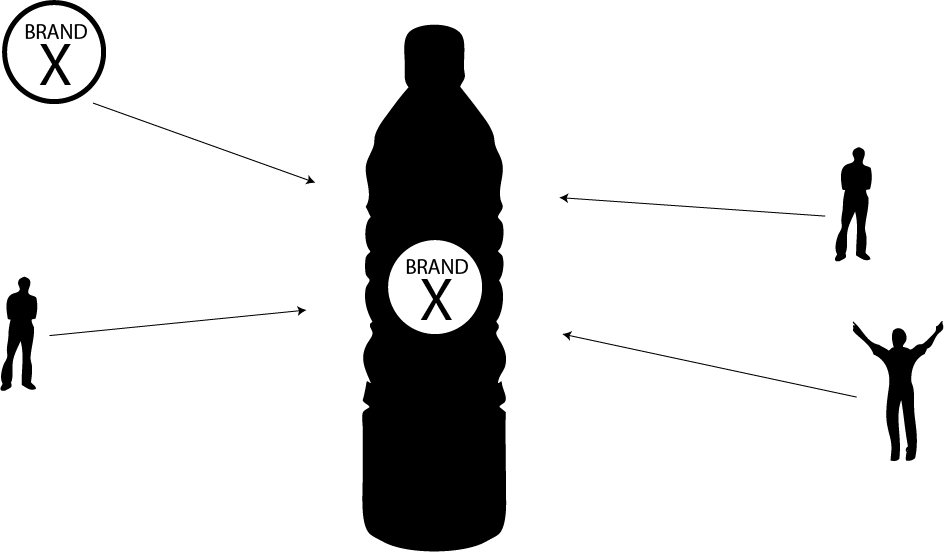
The physical packaging of products usually hosts information and messages which are created by a very limited number of voices (e.g.: the manufacturer, marketing team..).
In the drawing we see depicted a scenario which is becoming progressively more frequent: a multiplicity of subjects are now able to join the Brand in adding digital information to products and services, using Augmented Reality, QRCodes, computer vision, tagging (e.g.: RFID) and location based technologies. We call this Ubiquitous Publishing.
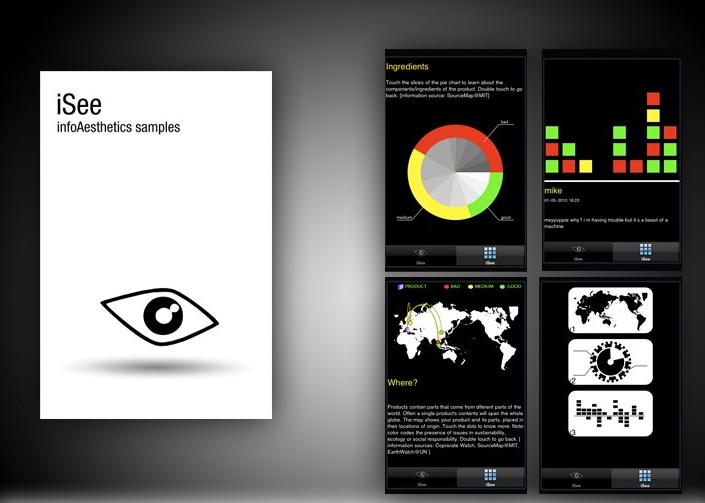
For example, in the Squatting Supermarkets project we used products’ packaging as visual reference for critical Augmented Reality experiences. In the performance, people could use their smartphone to “look at” products on a supermarket shell. When they did, a series of information became available:
- a map, created using MIT’s Open Source Map, showing where the product and its components came from, where its materials came from, where it had been processed and assembled, and in which places it stopped during transportation; the product becomes a map of the planet highlighting all the places which it touched during its manufacturing and distribution processes;
- a series of visualizations showing the product’s composition, the percentages of organics, chemicals, fat, aromas… all shown through interactive information visualizations.
One of the visualization was analyzed in deeper detail. On the top right of the previous image, is a timeline of the real-time conversations about the product: the timeline scrolls left and right and each colored block represents a conversation and its general sentiment (meaning: the sentiment which is most represented in the conversation); green, yellow and red code positive, mixed and negative sentiments.
So: while strolling through the aisles of a supermarket, you take a take a picture of your favorite product and you are able to see what people on social networks are saying about it, in real-time.
We observed this possibility (to publish real-time, user generated information using ubiquitous publishing techniques and accessible information visualizations) to describe an interesting loop which we are able to make.
We can imagine (and do) to harvest user generated information in real-time about our topics of interest (from blogs, websites, social networks and social media sites) and to publish them when/where they are most useful.
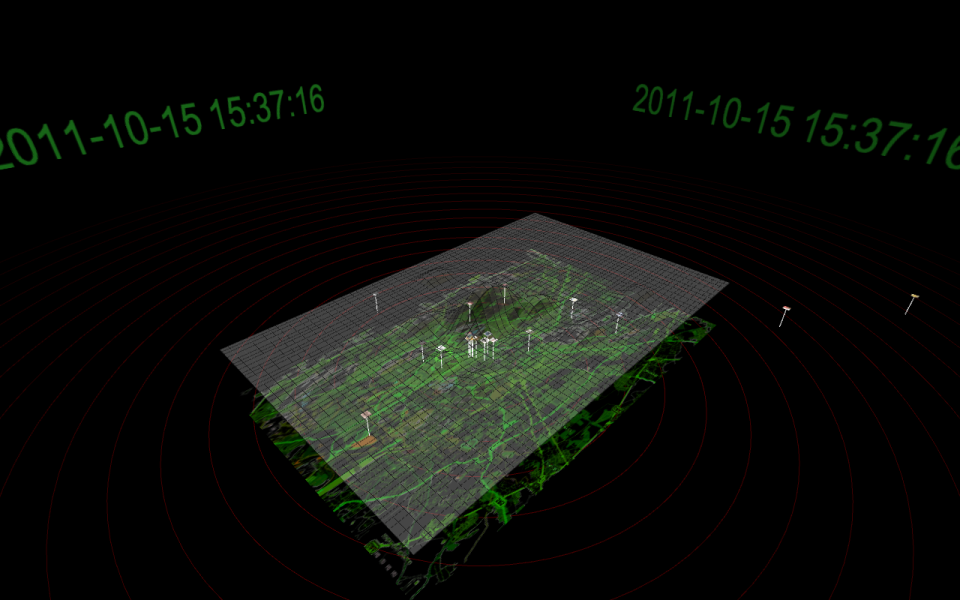
The image above shows the experiment we performed with the VersuS project during the city-wide riots taking place in Rome on October 15th 2011.
The 3D surface covering the map of the city of Rome shows the intensities of the social network conversations taking place during the protests and riots. The image is part of a real-time visualization through which we have been able to observe how social media conversations closely followed the evolution of the protest.
By using harvested conversations (from Facebook, Twitter, Flickr and Foursquare) we have been able to analyze what was being said and where, and we actually were able to demonstrate how a massive amount of useful information was being published by users: about violence, injuries, possible escape routes, missing people. All this information could have been actually collected and organized, and accessed by protesters through specifically designed interfaces to achieve important, pragmatic results such as avoiding being hurt, finding safe escape routes from the riots or find our friends who were lost in them.
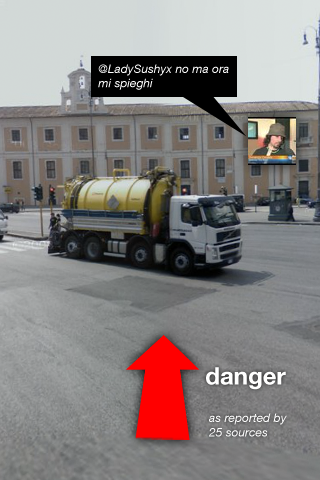
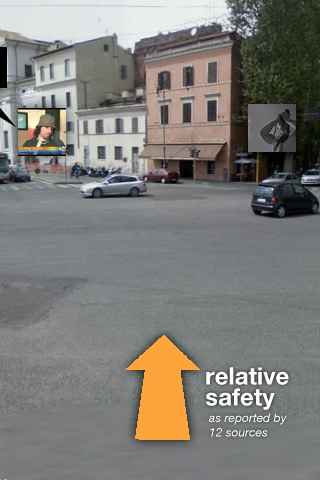
We were able to design, for example, the simple Augmented Reality application for smartphones pictured below:
This experimental interface shows how a rioter could have visualized on the screen of the smartphone the degree of safety in the direction he/she was facing, as it could be inferred by the social media conversations with a geographic reference.
An immediate, easy to use tool to achieve important goals.
During the lesson we focused on how it would be possible to use these technological opportunities to conceive and enact innovative communication practices.
We described a couple of scenarios, which we can imagine being applied in different forms, ranging from the creation of scenarios for the public lives of cities and their citizens, to the needs of communicators for their work with enterprises and administrations, to the needs of marketing and advertising.
In synthesis, we imagined a novel, more extensive, definition for Augmented Reality, according to which a loop is formed among the digital and physical world.
In this definition of AR it is possible
- to harvest user-generated (as well as database and sensor generated) real-time information about relevant places/topics/products/services,
- to process it using techniques such as Natural Language Processing and Sentiment Analysis,
- to publish it ubiquitously, where/when it is more useful, using interfaces and interaction schemes which ensure accessibility and usability (including smartphone apps, urban screens, wearable technologies, digital networked devices, information displays…) and
- to provide ways according to which users are able to both contribute to the flow of information and to re-assemble and re-interpret it, creating additional points of view
![[ AOS ] Art is Open Source](https://www.artisopensource.net/network/artisopensource/wp-content/uploads/2020/03/AOSLogo-01.png)
